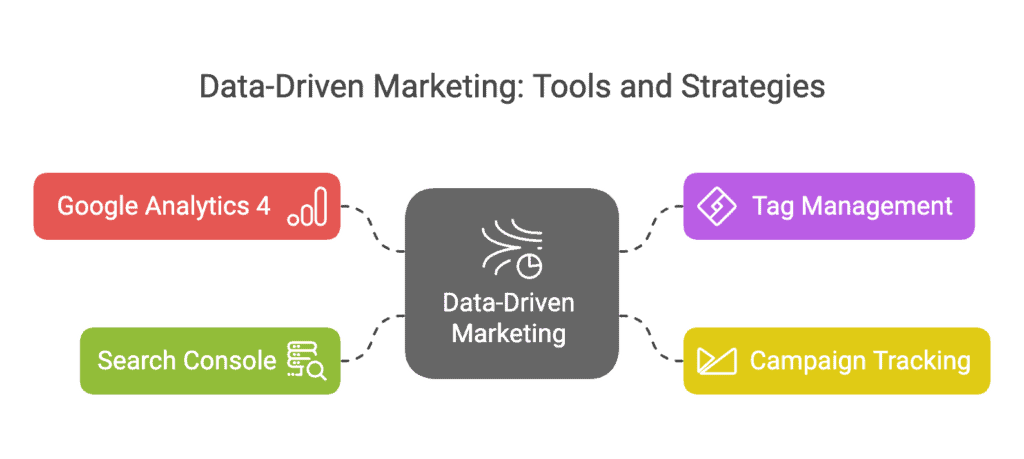
In this comprehensive guide, you’ll discover how to transform your marketing strategy using data-driven approaches that eliminate guesswork and maximize ROI. I’ll walk you through the essential analytics tools and metrics that every marketer needs to master in 2025.
Here’s what we’ll cover:
- The fundamentals of data-driven marketing and why it matters
- Setting up and mastering Google Analytics 4
- Implementing tag management systems and tracking pixels
- Leveraging Google Search Console for SEO insights
- Creating effective dashboards and using monitoring tools
Overview of Data-Driven Marketing
Data-driven marketing transforms how you make decisions by replacing gut feelings with concrete evidence.
Instead of wondering which campaigns work, you’ll know exactly where to invest your marketing dollars. The difference between guessing and knowing is often the difference between failure and success.
Data-driven marketing means collecting, analyzing, and applying customer and market data to optimize your marketing efforts. It’s about measuring what matters and using those insights to drive action.
The benefits are massive:
- Improved ROI – Stop wasting money on ineffective tactics
- Better personalization – Deliver the right message to the right person
- Faster optimization – Identify and fix problems before they cost you
- Clearer strategy – Base decisions on facts, not assumptions
- Competitive advantage – Outperform competitors who aren’t leveraging data
Most marketers think they’re data-driven, but they’re just data-informed. Being truly data-driven means letting the numbers guide your strategy, not just using them to justify what you already wanted to do.
Beginner Task: Identify 3-5 key metrics that directly align with your business objectives (like conversion rate, customer acquisition cost, or email open rate) and start tracking them weekly.
Advanced Task: Implement an A/B testing program that tests at least one element of your marketing each month based on data insights, documenting the hypothesis, methodology, and results in a testing roadmap.
Google Analytics (GA4)
GA4 has replaced Universal Analytics as Google’s primary analytics platform, bringing machine learning, cross-platform tracking, and event-based measurements to the forefront.
If you’re still using the old version or haven’t set up analytics at all, you’re missing crucial insights about your audience and their behavior.
Setup
Setting up GA4 properly is the foundation for all your future analysis.
First, you need to create a GA4 property in your Google Analytics account. This is different from the old Universal Analytics properties, so even if you had analytics before, you’ll need to set up a new property.
Here’s how to get started:
- Go to analytics.google.com and sign in
- Click “Admin” in the bottom left corner
- In the Account column, select your account (or create a new one)
- In the Property column, click “Create Property”
- Select “Web,” “iOS app,” or “Android app” depending on what you’re tracking
- Follow the prompts to complete setup
The most critical part is adding the tracking code to your website. You have two options:
- Add the GA4 tag directly to your site’s code (typically in the header)
- Use Google Tag Manager (which I recommend for more flexibility)
Make sure to verify that your tracking is working by checking the real-time reports after implementation.
Beginner Task: Set up a basic GA4 property for your website and confirm that it’s recording traffic by checking the real-time reports.
Advanced Task: Configure custom dimensions and metrics in GA4 that align with your specific business KPIs, such as customer segments, engagement scores, or custom conversion values.
Event Tracking
In GA4, everything is an event. This is a major change from Universal Analytics.
Events are user interactions with your content, from page views and clicks to conversions and transactions. GA4 automatically tracks many events, but the real power comes from custom events.
The key events you should track include:
- Page views – Automatically tracked
- Scrolls – Know how far users read your content
- Outbound clicks – See when users leave your site
- Site search – Understand what users are looking for
- Video engagement – Track plays, pauses, and completions
- File downloads – Monitor resource downloads
- Form submissions – Critical for lead generation
Setting up custom events is straightforward:
- In your GA4 property, go to Configure > Events
- Click “Create Event”
- Name your event (use clear, descriptive names)
- Define the conditions that trigger the event
- Add parameters if needed for additional context
- Save and publish
Don’t make the mistake of tracking everything just because you can. Focus on events that provide actionable insights related to your business goals.
Beginner Task: Set up event tracking for at least one critical user action on your site, such as form submissions or product views.
Advanced Task: Create a comprehensive event tracking plan that maps your entire customer journey, documenting each touchpoint and implementing appropriate tracking for each stage.
Funnel Analysis & Drop-Off Optimization
Funnel analysis is where GA4 really shines compared to its predecessor.
A funnel visualizes the steps users take toward a conversion and, more importantly, where they drop off. This insight is pure gold for optimizing your conversion rates.
To create a funnel report in GA4:
- Go to Explore > Blank
- Add a new tab for Funnel exploration
- Configure your funnel steps using events
- Adjust the time range as needed
- Create segments to compare different user groups
The key to effective funnel analysis is identifying the biggest drop-off points and investigating why users are leaving at those stages.
Common reasons for drop-offs include:
- Confusing UI/UX – Users can’t figure out what to do next
- Technical issues – Forms that don’t work on mobile, slow loading times
- Credibility problems – Users don’t trust you enough to continue
- Value proposition issues – Benefits aren’t clear enough
- Friction points – Too many form fields, complicated checkout process
Once you identify these issues, you can test solutions and measure the impact on your conversion rates.
Beginner Task: Create a basic funnel in GA4 that tracks your primary conversion path (like landing page → product page → add to cart → checkout → purchase).
Advanced Task: Implement an exit-intent survey on your highest drop-off page to gather qualitative data about why users are abandoning, then create an A/B test based on this feedback.
Tag Management & Tracking Pixels

Managing various tracking codes can quickly become a nightmare without a proper system in place.
This is where tag management systems come in, with Google Tag Manager (GTM) being the most widely used option.
Google Tag Manager Best Practices
Google Tag Manager revolutionizes how you implement tracking on your website without needing a developer for every change.
Think of GTM as a container that holds all your tracking codes and tells them when to fire based on specific triggers.
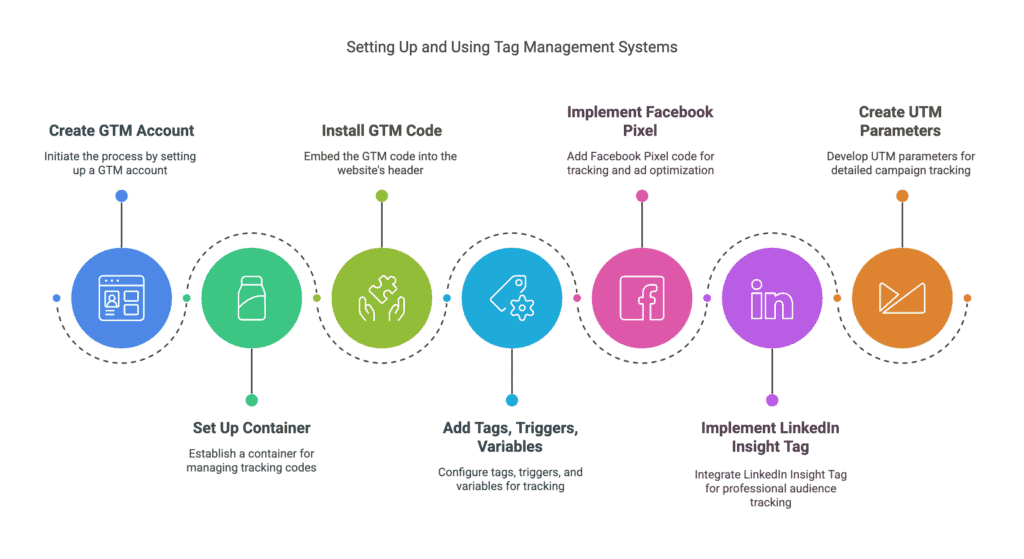
Here’s how to get started:
- Create a GTM account at tagmanager.google.com
- Set up a container for your website
- Install the GTM code on your site (usually in the header)
- Start adding tags, triggers, and variables
The core components of GTM are:
- Tags – The tracking codes themselves (GA4, Facebook Pixel, etc.)
- Triggers – Conditions that determine when tags fire (page views, clicks, etc.)
- Variables – Information used by tags and triggers (page URL, click text, etc.)
Best practices for GTM implementation include:
- Use folders to organize your tags by platform or purpose
- Implement a naming convention for all elements
- Utilize workspaces for testing before publishing
- Document everything – purpose, implementation date, owner
- Regularly audit your tags to remove outdated ones
Beginner Task: Set up Google Tag Manager on your site and migrate your Google Analytics tracking from direct implementation to GTM.
Advanced Task: Create a custom HTML tag in GTM that fires only for specific user segments (like returning visitors or users from particular traffic sources) to deliver personalized experiences.
Facebook Pixel & LinkedIn Insight Tag
Platform-specific pixels are essential for tracking and optimizing ad campaigns.
The Facebook Pixel is a piece of code that tracks user interactions on your website and connects them to your Facebook ad account. This enables:
- Custom audience creation based on website behavior
- Conversion tracking for your Facebook ads
- Retargeting campaigns to website visitors
- Optimization for specific events like purchases
Implementation steps:
- Create a pixel in Facebook Business Manager
- Add the base pixel code to your site (ideally through GTM)
- Set up standard events (like Purchase, Lead, Add to Cart)
- Verify the pixel is working using the Facebook Pixel Helper extension
Similarly, the LinkedIn Insight Tag helps you track conversions, retarget website visitors, and gain demographic insights about your professional audience.
To implement:
- Generate your Insight Tag in LinkedIn Campaign Manager
- Add the tag to your site (again, GTM is recommended)
- Create conversion actions for tracking
- Start building matched audiences for retargeting
Both platforms offer powerful analytics beyond just ad performance. Facebook’s Audience Insights and LinkedIn’s Website Demographics provide valuable information about who’s visiting your site.
Beginner Task: Install the Facebook Pixel on your website and set up basic PageView tracking.
Advanced Task: Configure dynamic event parameters that pass variable values (like purchase value or product categories) to your Facebook Pixel or LinkedIn Insight Tag for more granular audience targeting.
UTM Parameters for Campaign Tracking
UTM parameters are the unsung heroes of campaign tracking.
These simple text additions to your URLs tell your analytics tools exactly where your traffic is coming from. Without them, you’re flying blind on campaign performance.
The five standard UTM parameters are:
- utm_source – Identifies the source of your traffic (facebook, newsletter, google)
- utm_medium – The marketing medium (cpc, email, social)
- utm_campaign – Your specific campaign name (spring_sale, product_launch)
- utm_term – Identifies paid search keywords (optional)
- utm_content – Distinguishes between similar content or links (optional)
For example, a properly tagged URL might look like:
Best practices for UTM parameters:
- Be consistent with naming conventions
- Document your parameter structure in a shared spreadsheet
- Use lowercase to avoid duplication issues
- Keep names short but descriptive
- Avoid spaces (use underscores or hyphens instead)
Tools like Google’s Campaign URL Builder can help you generate these URLs correctly.
Beginner Task: Create UTM parameters for your next email campaign and track the results in Google Analytics.
Advanced Task: Build an automated UTM parameter system using Google Sheets and Zapier that ensures consistent tracking across all marketing channels and team members.
Google Search Console

Google Search Console (GSC) is your window into how Google sees your website.
While GA4 tells you what happens when users are on your site, GSC tells you what happens before they get there – in the search results.
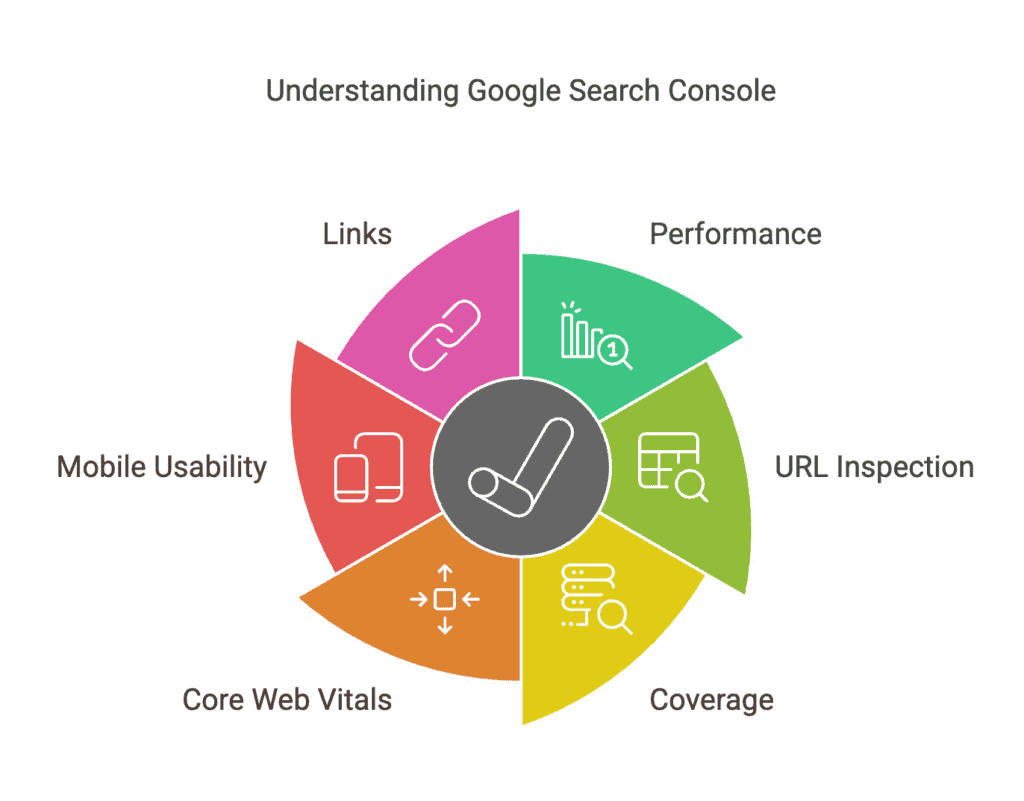
The key reports in GSC include:
- Performance – Shows clicks, impressions, CTR, and position for your keywords
- URL Inspection – Allows you to check how Google sees specific pages
- Coverage – Highlights indexing issues that need attention
- Core Web Vitals – Measures page experience metrics
- Mobile Usability – Identifies issues on mobile devices
- Links – Shows internal and external links to your site
To get started:
- Go to search.google.com/search-console
- Add and verify your property (domain or URL prefix)
- Wait for data to populate (this can take a few days)
The performance report is where you’ll spend most of your time. It shows:
- Which keywords are driving traffic to your site
- Which pages receive the most search traffic
- How your click-through rate compares to your position
- How your performance changes over time
This data is invaluable for SEO optimization. Look for:
- High impression, low CTR keywords – These need better meta titles/descriptions
- Position 11-20 keywords – These are on page 2 and could be pushed to page 1 with some optimization
- Declining trend lines – These may indicate emerging problems
Beginner Task: Connect your website to Google Search Console and identify your top 10 performing keywords.
Advanced Task: Create a monthly SEO optimization workflow that uses Search Console data to identify underperforming content, then implement and track improvements.
Dashboards and Other User Monitoring Software
Dashboards bring all your data together in one place for easy visualization and analysis.
Having a well-designed dashboard saves hours of report hunting and makes data accessible to everyone on your team, regardless of their technical expertise.
Popular dashboard tools include:
- Google Data Studio (now called Looker Studio) – Free and integrates well with Google products
- Tableau – More powerful but comes with a learning curve and cost
- PowerBI – Microsoft’s solution with strong Excel integration
- Databox – User-friendly with many pre-built marketing templates
- Klipfolio – Flexible with diverse integration options
When creating dashboards, follow these principles:
- Start with the questions you need to answer, not the data you have
- Limit each dashboard to 5-9 key metrics to avoid overwhelm
- Use appropriate visualizations for different data types
- Include context like goals and historical comparisons
- Make it actionable – every metric should have a potential action attached
Beyond basic analytics, consider these specialized monitoring tools:
- Hotjar or Crazy Egg – Heatmaps, session recordings, and user feedback
- FullStory – Detailed user session playback and interaction analysis
- Optimizely – A/B testing and experimentation platform
- Mixpanel – Product analytics focused on user behavior flows
- Heap – Automatic event capturing without manual tagging
Beginner Task: Create a simple dashboard in Google Data Studio (Looker Studio) that displays your key website metrics from Google Analytics.
Advanced Task: Implement heatmap and session recording software on your highest-value pages, then create a systematic process for reviewing recordings weekly and implementing UX improvements based on the findings.
Conclusion
Data-driven marketing isn’t optional anymore – it’s essential for survival in today’s competitive landscape.
The tools and strategies outlined in this guide give you everything you need to start making smarter, more effective marketing decisions based on real data rather than hunches.
Don’t try to implement everything at once. Start with the foundations – proper GA4 setup, basic event tracking, and campaign tagging – then gradually add more sophisticated analyses as you grow comfortable with the basics.
Remember: the goal isn’t to collect data; it’s to gain insights that drive action. Every metric you track should connect to a potential decision or optimization.
Now it’s your turn. Pick one section from this guide and implement it this week. Then come back for the next step. Your marketing ROI will thank you.
